

The Vision
The goal of the Triple-I’s Resilience Accelerator is to demonstrate the power of insurance as a force for resilience by telling the story of how insurance coverage helps governments, businesses and individuals recover faster and more completely after catastrophes.
Working with our partners, the Triple-I will use advanced data analytics to create tools that empower consumers, businesses, and governments to build more resilient communities before perils happen – and to speed up the pace of the recovery after. By socializing data and making it more transparent and actionable, the Resilience Accelerator will enable users to allocate resources more effectively toward safeguarding against loss of life and property.
Closing ‘the gap’
Dr. Steven Weisbart, Triple-I chief economist, outlines key practical and behavioral patterns that create “coverage gaps,” and the role the Resilience Accelerator will play in laying out the value of resilience in terms of lives saved and uninsured financial losses averted.
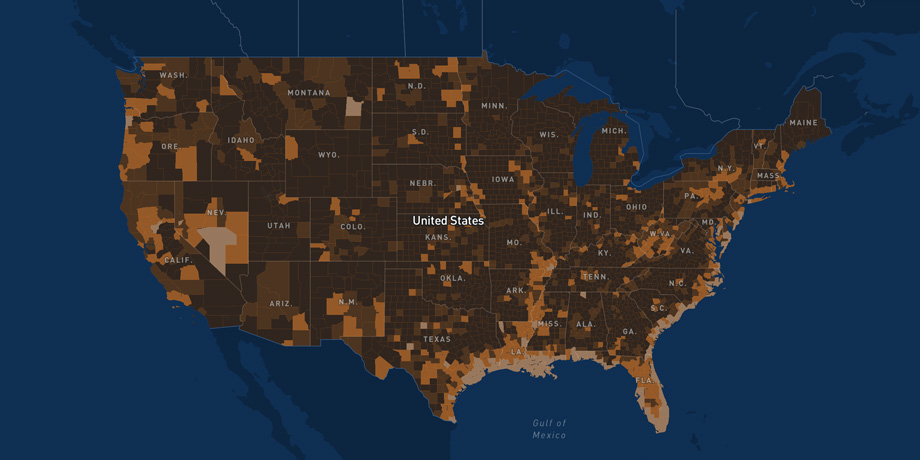
Map and data
The Resilience Project interactive map brings into one place data from insurance companies, government agencies, regulators and Triple-I research. The results provide data, analysis and insight so users can look at catastrophes from many points of view and take action.
Forecast
The forecast provides a look at the 2019 hurricane season to visualize probabilities at the state level. These data come from the 2020 Hurricane Season Forecast, published by Triple-I non-resident scholar, Dr. Philip Klotzbach, meteorologist at Colorado State University’s Tropical Meteorology Project (TMP).
Track
This feature uses NOAA geo-positioning data to track the path and strength of hurricanes and major tropical storms moving through the Atlantic Basin toward a U.S. landfall. The path visualization is color-keyed to depict the changing strength of each storm, based on wind speed along the storm’s full path.
Damage and claims
This feature provides data about an individual hurricane or tropical storm’s total damage and paid insurance claims. Users can view the data by storm across states from 1996 to 2018 – as well as for Hurricane Andrew in 1992. The visualization is based on government data in the public domain, as aggregated and analyzed by Aon.
NFIP
This tab visualizes year-over-year changes in NFIP policy take-up rates as estimated by Aon. To provide context, users can access data about the number of NFIP policies, total insured value, premium collected and the number of covered housing units. By doing so they can better understand nationwide trends or explore differences in how communities use NFIP coverage.

Methodology
The Resilience Project website uses interactive infographics to visualize static data. Starting this year, the Triple-I will work with partners to build a proprietary resilience model using best-in-class data and machine learning analytics to quantify how insurance contributes to quickening recovery after extreme weather events.
Data
Because models are only as good as the data they use, the Triple-I’s position at the intersection of the insurance industry, governments and consumers will enable the Resilience Project to acquire, combine and structure data across sources and types of natural catastrophe analytics into a single unified taxonomy and database.
Analytics
Working with our partners across the industry, government and academia, Triple-I’s experts will develop analytics that combine traditional and machine-learning statistical tools. With a focus on econometrics, decision trees and neural network approaches, our model will provide transparent and actionable insight that can be combined with existing extreme weather models to integrate the role of insurance in advancing preemptive risk mitigation and accelerating the recovery.